Your YouTube views are climbing, but estimated unique viewers have barely moved. That can look like the same audience is watching more often—but Analytics does not establish that conclusion by itself. Before interpreting the gap as loyalty, weak discovery, or any other single story, check whether the two measurements cover the same period, formats, videos, and distribution surfaces.
YouTube Views Up but Unique Viewers Flat: The Contradiction
Views and estimated unique viewers describe different dimensions of channel activity. Views count legitimate plays. Estimated unique viewers are an estimate of the people who watched during a selected date range. One is primarily a play count; the other is a people-based audience estimate.
That difference makes a divergence possible without proving why it happened. More plays can result from a changing mix of uploads, older catalog videos, live streams, or traffic sources. A flat people-based estimate may also reflect how reports are scoped and updated. The figures deserve investigation, not an automatic behavioral label.
You can calculate views divided by estimated unique viewers as a rough, analyst-created frequency indicator. If a report shows 20,000 views and an estimated 10,000 viewers, the arithmetic result is 2. But YouTube does not define this ratio as an official loyalty, satisfaction, intent, or future-retention score. It combines two measures with their own boundaries, so treat it as a descriptive comparison rather than a verdict about your audience.
Align YouTube Audience Metrics Before Interpreting Them
- Views
- Legitimate plays recorded within the report’s selected scope.
- Estimated unique viewers
- An estimate of the viewers who watched during a selected date range. It is not the same type of measure as total plays.
- Monthly audience
- An estimated audience calculated over a rolling 28-day window. Because the window moves daily, it should not be treated as a fixed-period views or unique-viewers total.
- Views per estimated unique viewer
- A derived ratio that can describe playback frequency within a comparison, but does not validate loyalty, satisfaction, or future return behavior.
For a meaningful comparison, align the date ranges first. A 28-day views report and a monthly audience figure may sound equivalent while covering different windows. YouTube also notes that new audience-segment data can take one to two days to update, so a recently flat segment line may not be settled evidence.
For the platform’s metric definitions and scope, see YouTube’s audience metric documentation. The scope matters because audience reporting can include Shorts, video-on-demand content, live streams, and other channel content. A channel-level total may therefore combine several viewing experiences rather than describe one uniform audience.
How Format Mix Can Hide the Source of Higher Views
Consider a hypothetical channel that publishes one long-form video each week, several Shorts, and occasional live streams. During one reporting period, an older tutorial starts receiving steady traffic while new Shorts add many plays. Total channel views rise sharply, yet estimated unique viewers remain close to the previous period.
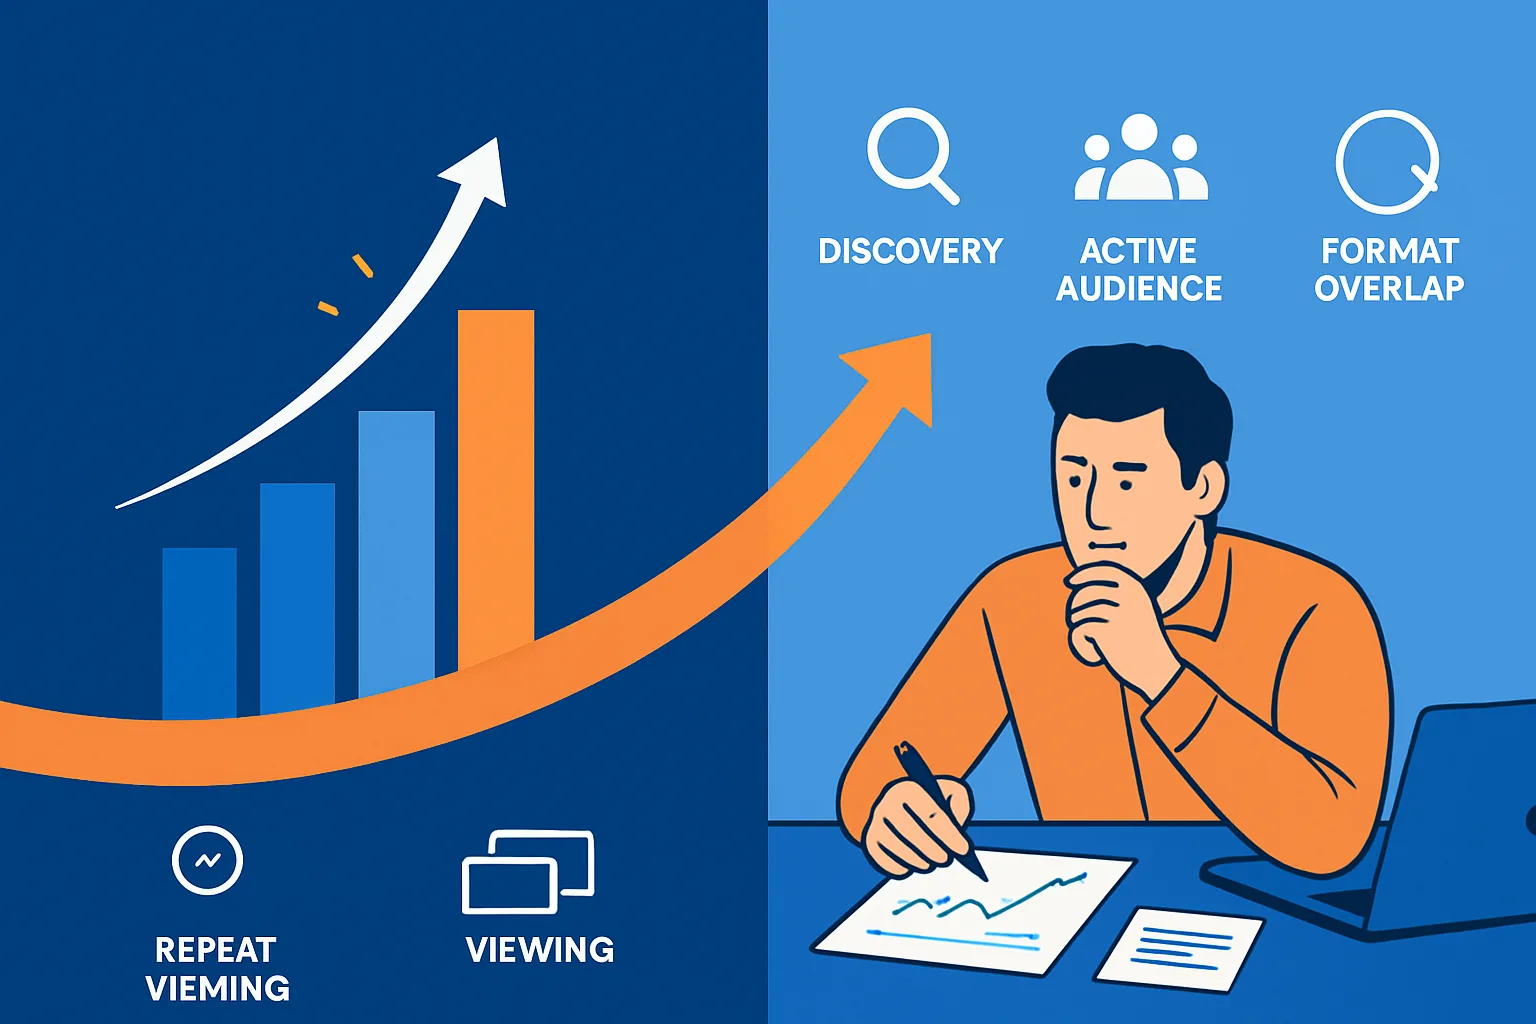
Several explanations remain possible. The additional plays may be concentrated among people already counted in the selected audience estimate. The format mix may have changed, with Shorts and long-form content contributing differently to the channel total. Or the audience measure may use a rolling window that does not match the fixed period used for the views comparison. The available figures do not select one explanation automatically.
Video age is another scope question. A current upload and a back-catalog video can contribute to the same channel report even though their distribution contexts differ. The total can hide whether the increase came from recent uploads, older videos, live viewing, or a combination.
One observational study of Shorts and long-form performance found different patterns across creator cohorts, but it did not measure this unique-viewer contradiction or prove that Shorts caused it. Format mix is therefore a reason to examine reports separately—not a universal explanation.
Check YouTube Traffic Sources, Formats, and Reporting Limits
Use YouTube Studio’s comparison and grouping capabilities where they are available. Advanced Mode supports changing timeframes and reports, applying filters, comparing results, and grouping videos or other content. Interface labels and navigation can vary during Studio updates, so focus on making aligned comparisons rather than memorizing one permanent menu path.
- Do the date windows match? Compare the same start and end dates where possible. If one figure is a rolling 28-day audience measure and the other is a fixed-period total, record that difference before drawing an inference.
- Are formats and video ages separated? Examine Shorts, long-form uploads, live streams, and older catalog videos in useful groups. This identifies which content contributed to the view increase without assuming that the audiences overlap—or do not overlap.
- Which traffic-source categories changed? Review categories such as Browse, Search, Suggested, Shorts, Notifications, Playlists, External, and Direct or unknown. These describe attributed distribution, not viewer identity. Search does not automatically mean new viewers, and Notifications do not automatically mean loyal viewers.
- What do the audience segments show? New, casual, regular, and returning viewers are categories based on prior or repeated viewing during specified historical periods. They can add context, but they should not be relabeled as satisfaction, loyalty, intent, or guaranteed future return.
- Could limited reporting affect the pattern? Missing rows, limited-data thresholds, aggregation differences, and report-to-report discrepancies can affect Analytics. An absent value is not necessarily zero activity.
- Are impressions being used as a universal denominator? A registered impression requires a thumbnail to be shown for more than one second with at least 50% visibility. YouTube excludes surfaces such as external websites and apps, notifications, embedded-player elements, mobile web, YouTube Kids, and YouTube Music. Impressions therefore cannot account for every view.
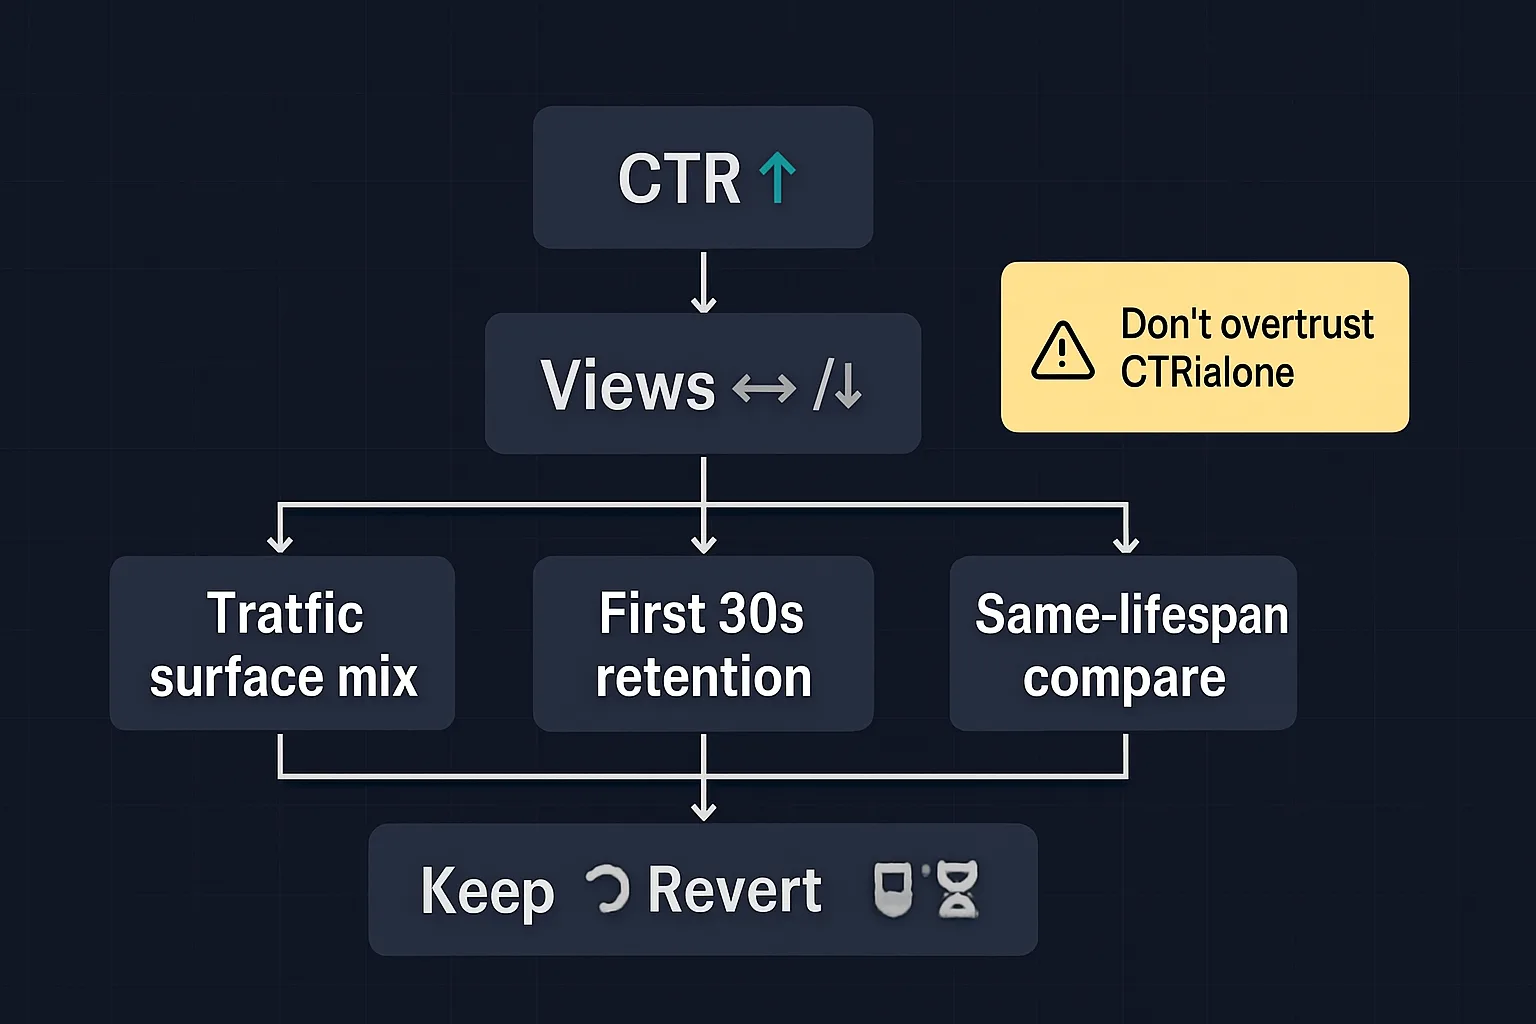
These are independent checks, not a guaranteed causal decision tree. A traffic-source change can coexist with a format change, an older video can overlap the same reporting window, and limited data may affect only some reports. Compare aligned groups before combining their signals into one channel-wide explanation.
What Flat Unique Viewers Still Cannot Prove
After the scopes are aligned, a higher views-to-viewer ratio may be consistent with more plays per estimated viewer in that comparison. It still does not prove that the same individuals watched repeatedly, that they felt more satisfied, or that they will return in the future. Flat estimated unique viewers also do not prove weak discovery, audience overlap across formats, or a measurement failure.
If reports remain difficult to reconcile, consult YouTube’s Analytics data limitations rather than filling gaps with speculation. The defensible interpretation is narrow: views increased relative to the available estimated audience measure, while the reason remains unresolved until the periods, formats, video age, traffic sources, segments, and reporting limitations have been examined together.